Bybit: BTC Suffers Its Worst Quarter in Over a Decade
BTC has suffered its worst quarterly loss in recent years, with both price and blockchain activity plunging drastically in the month of June. The bellwether cryptocurrency lost over 58% of its value in the second quarter of 2022, falling from around $47,900 at the start of the quarter to $19,900 on Thursday. Bybit Blog reports.
Within the past quarter, BTC recorded nine consecutive weekly red candles and suffered a substantial drawdown of over 37% in June. This was the heaviest monthly loss since December 2013, which saw prices fall more than 38.7% in the month.
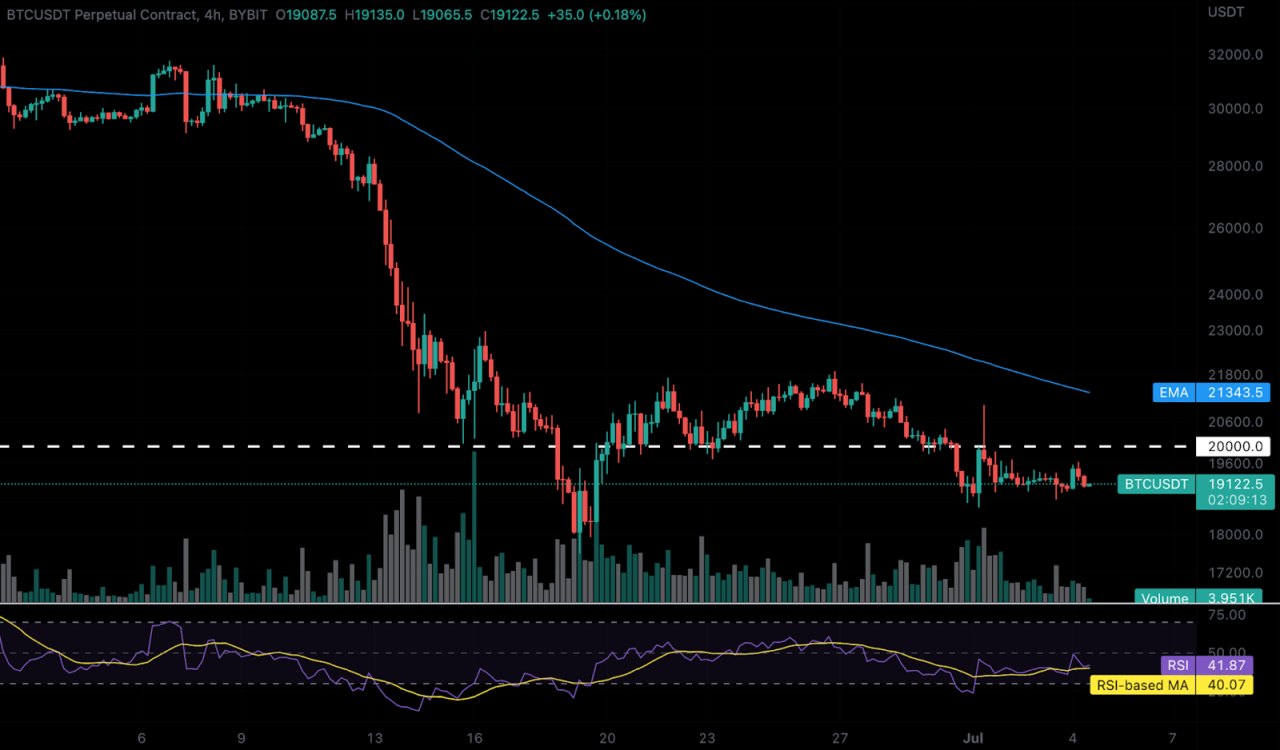
Over the weekend, BTC hovered just above $19,000 after briefly plunging below it on Thursday following the latest drumbeat of discouraging economic indicators.

Over the past week, BTC price action has remained weak, with some volatility seen on both sides. The price of BTC briefly fell below $19,000 on Thursday as the bears continued to dominate the market. It was evident in BTC’s rejection candle on July 1, that the bears continued to sell on rallies near the 20-day exponential moving average (EMA) at $21,343. Despite pushing BTC down to $18,600, the bears were unable to build upon this momentum.
As such, a near-term rebound seems plausible for BTC, possibly rising towards the 20-day EMA if the bulls can establish a foothold above $19,000 in the coming days. Any sustained momentum above $22,000 could propel BTC towards its 50-day EMA at $25,900.
It is also worth noting that BTC’s trading volume reached an all-time high in June. It is generally believed that the highest volume during a downtrend indicates capitulation and often precedes a major market bottom. If BTC follows the historical pattern of the previous bear market cycles, a market bottom could be formed in the coming months.
Check Out the Latest Prices, Charts and Data for BTCUSDT!
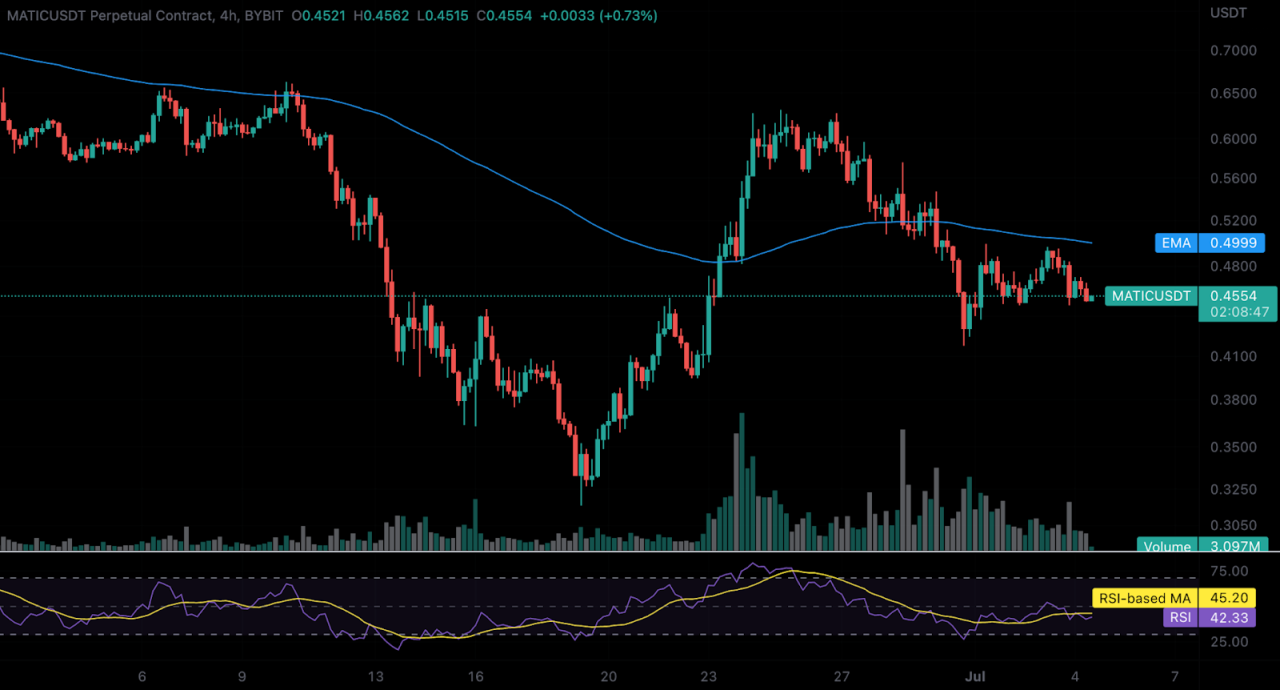
It has been a period of considerable volatility for MATIC in recent weeks. After rallying more than 45% in the previous week, the token has retreated almost 20% as speculators take profits.
The bearish trend started on Tuesday, June 28, after MATIC overturned from a strong overhead resistance level of $0.61, in which the bears drove MATIC down to a low of $0.415.

Despite the recent sell-off, the Relative Strength Index (RSI) indicator suggests that the bears may be losing their grip. The RSI indicator has started to recover from oversold levels, suggesting that MATIC has gained positive momentum.
The $0.61 resistance zone remains the key level for MATIC. A break above the $0.61 level could clear the path for a possible rally to $0.75. On the other hand, if the price slides below $0.41, it will suggest that the recent recovery may be considered a bear market rally.
Check Out the Latest Prices, Charts and Data for MATICUSDT!
